Heat maps have many uses, really as many as we want to give it, since it is one more way to represent data such as graphs or tables.
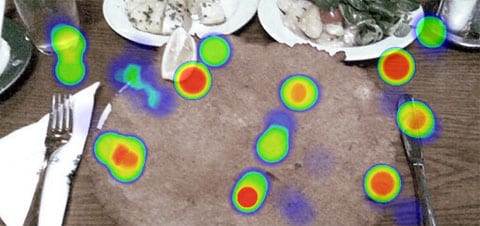
With Heatmap.js we can create really interesting heat maps thanks to the Canvas element, all through the use of coordinates that we pass to the script, which later interprets and draws them.
Not that it has a lot of practical uses, but it seems like a really interesting resource.
Link | heatmap.js
Source | WebResourcesDepot