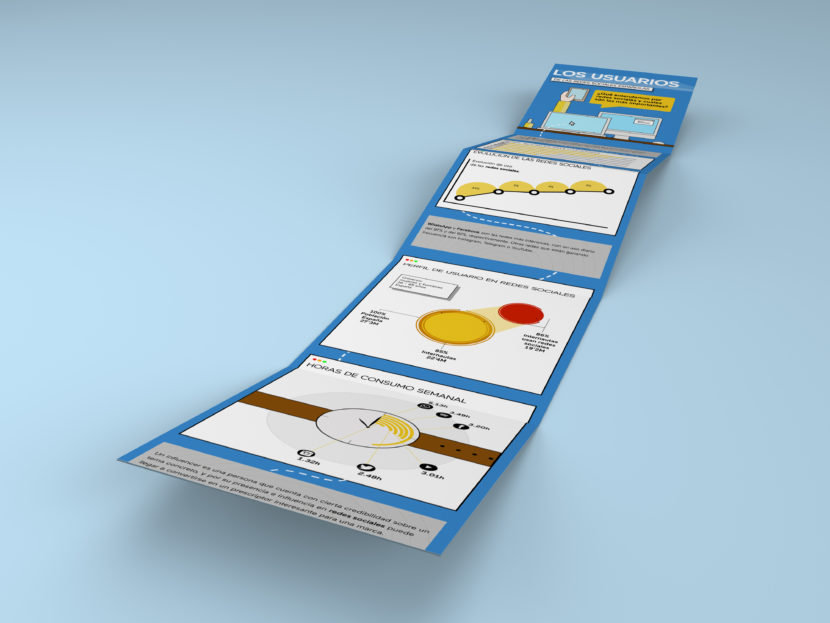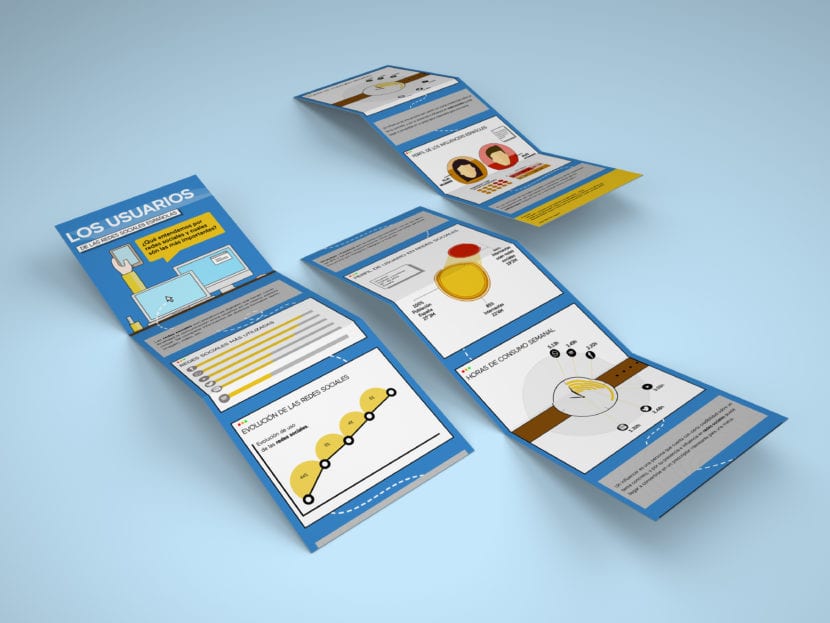
An infographic is a tool that allows visually provide information with a schematic presentation that summarizes data and explains it through graphics, icons in an easy-to-understand way.
They are used to understand, relate or structure information in a clear, simple, graphic and dynamic way to make their understanding and assimilation of the contents clearer. In short, they are useful for communicate complex concepts which from other supports would be monotonous and difficult to understand.
They are also used for visualize data and synthesize quantities very large amounts of information or understand processes. It is an effective communication if we want to capture the attention of the receiver.
To make an infographic, the first thing we must do is select a topic. You will have to do research and collect information to later select the most relevant one. There are many infographic types, can help you clarify how to order the information.
We are going to see what types of infographics exist, we are going to focus on six types, keep in mind that as long as you do it with sense, you can use more than one.

Types of infographics
- Sequential: Present a story step by step or in stages. You can segment by years, days, months, hours, among others.
- Procedural: Process that has its beginning and has an end and is divided into stages. A good idea is to apply a color to each of the stages, it will bring us clarity when it comes to segmenting the information.
- Geographical: It is used to indicate information about a space, place, country or space.
- Characteristic: It is the most used, it refers to a product, situation, object, etc. We refer to some specific characteristics, all the properties and characteristics of something specific.
- Statistics: It represents the management of more impactful and relevant information data. It is the handling of a lot of data with which it can be summarized in a visible way. Many numbers, hundreds and statistical data are used. It is a visible, easy and attractive way to understand and summarize a large number of data.
- Biographical: Describe the life or work of a character.
Above all, keep in mind to cite the sources, they must be reliable, this will help you to ensure that your research has quality information.