Believe it or not, infographics are a powerful weapon on the Internet. Not only do they help to summarize reports or very long articles, but they can also serve many other uses. And of course, there are many infographic designs.
For this reason, on this occasion, we want to help you understand what infographics are, their uses, how to make one and we will give you some templates or pages in which to make them. Let's go with it?
What are infographics

First of all, you should understand perfectly what we mean when we talk about infographics. These can be defined as a set of images, data, graphics and text that serves to summarize a complex topic by providing only the most important data.
We could say that it is like a summary but instead of using only text, it is adorned with those other elements that help a better visualization. In other words, it is the visual aspect of information and data.
What are they used for
Leaving the definition clear, understanding why infographics are important is not difficult. For example, imagine that you have a very extensive topic about fonts. You have to know what types there are, the characteristics, which ones are used more in the country, etc.
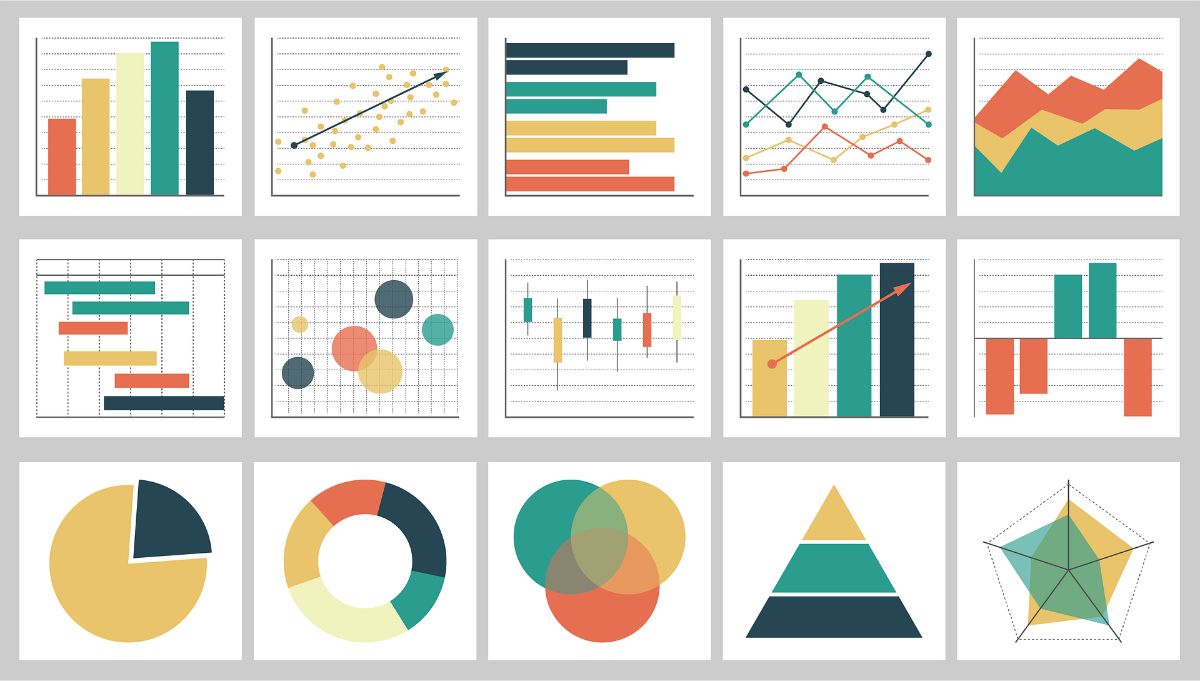
Instead of supporting you with text that can be boring, infographics give you all the information you need but in a more visual way. In this example that we have given you, it would be putting examples of the types of typography, a bar graph to know which one is used more in the country, and even types of each of those letters. What would be more striking? Well, that is what is intended, that the information is more attractive and, therefore, easier to read and internalize.
In general, the uses given to infographics are very varied. For example:
- To make summaries of topics that can be more complex.
- To explain a process.
- As a way of offering the results of a report, survey, research, etc.
- To compare.
- As a lead magnet (that is, an infographic that can help summarize a document that is offered free of charge in exchange for registering with your name and email).
It can also be used for other purposes, but the best known and most common are these.
How to make good infographics

Before leaving you the tools that will help you make infographics without having to start from scratch, we want to dwell for a moment on the keys that will ensure that the infographic you make achieves the desired effect, which will be to serve as a summary and capture the user's attention. .
How do you get that?
Collect all the information you want to put in the infographic
First of all, you need to know what you are going to put in this document so that you can organize it. If you start writing and putting images directly, the most normal thing is that you end up taking up too much space and also giving disorganized information.
Therefore, use a draft, either a notebook or a Word document in which you can write down everything you are going to put.
Then, you must sort all that information. How to do it? Prioritizing the key points; determining titles, subtitles, etc.; making sure it's not too much text; and using good quality images (or letter fonts that themselves help you decorate).
Make an infographic sketch
Before definitively capturing all the information, you should do a test of how it will look. In this way, if you change something before completing it, it will be much easier to solve the problem.
At this point you can do it from scratch or use a pre-designed template to help you go faster.
Aspects such as font, size, colors, background color, images, etc. they are very important and they all have to combine perfectly.
give your touch
Do not forget to give it that touch that only you know how to give it. Whether you use templates or make it from scratch, you have to give it "personality" and make it your own; Otherwise, you could fall into offering the same as everyone else and it would lose its charm.
Infographics Design Templates

We could be offering you thousands of templates and thousands of sites to download a huge collection of templates from. But in order not to bore you, the best places where we have seen that you have a lot of them are:
- Vengeance. Where in addition to choosing from many templates you can also edit / create it with your data so you can see the results.
- Adobe. In this case they are free and you have enough. In addition, it allows you to create it online so you do not need to do anything else.
- Freepik. You will have them in image format (and psd almost always) so it will be easy to work with it.
- Slidesgo. In this case, you have to be careful because the infographics that you can download here are adapted for Google Slides and PowerPoint, not for image editing programs.
- Template listings. Where you can find sites where they put to download various infographic design templates.
Websites and applications where to make infographic designs
If the previous templates, or the many that you can find on the Internet, are not enough for you, here we are going to give you a small list of websites and applications that you could use to make infographic designs. Each one of them has its own way of doing it, but if you have some design knowledge you will have no problem with them.
These are:
- Canvas. That not only offers you infographic designs, but also allows you to create your own.
- Piktochart. It is an app that, through templates, allows you to create your own infographics. Of course, you will only have 8 in the free version, but in the paid version you will have more than 600.
- Infogr.am. We really like this one because you can make interactive graphs and also upload your own data. It is paid, yes, but it has a free version where they give you almost 40 types of graphics and 13 maps. In addition, you can make dynamic infographics that, since they are not very common, have a greater impact on users.
- Graph. In this case it is for iPad and iPhone. You will be able to design not only infographics, but organization charts, mental maps, flowcharts...
- Great.ly. Another website to create interactive infographics. It is one of the most used because it allows you to insert videos, gifs, links, etc.
As you can see, making infographic designs is not as difficult as it seems. It is true that it will take time, but the truth is that with time, and practice, it will be easier and easier. Do you dare to make them for your work.